Indoor Air Monitoring
March 2023 to present
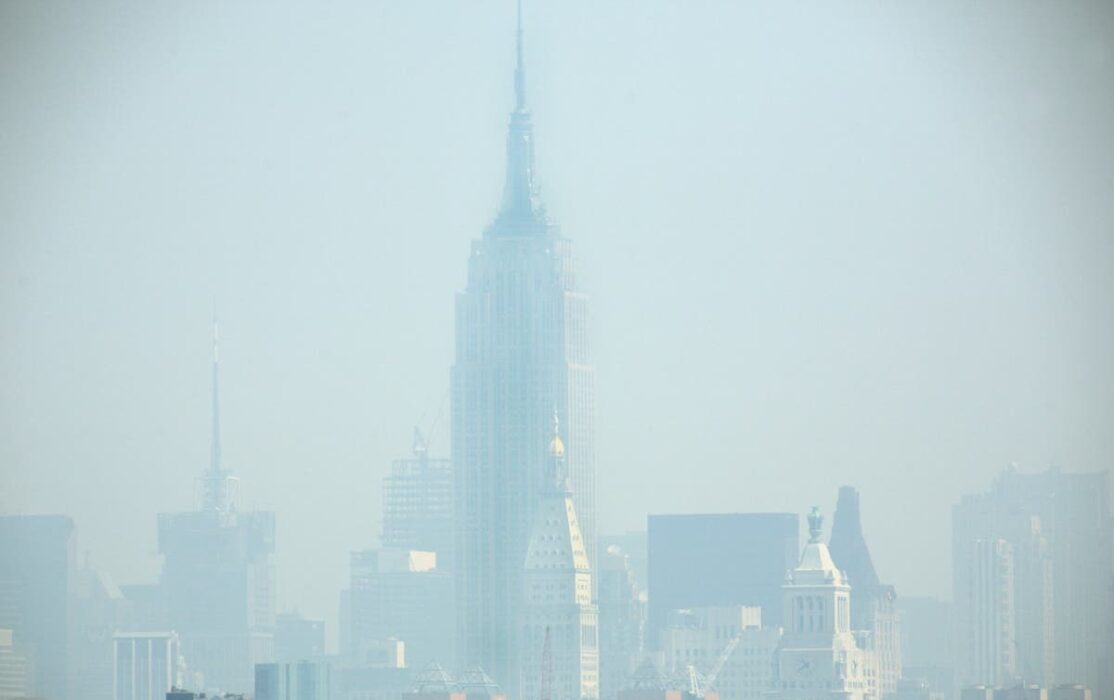
While we spend the majority of time indoors, the air quality inside our living spaces remains a scarcely studied topic. The indoor environment not only traps air pollution coming in from the outside, but also presents its own unique sources of pollution, e.g. cooking ranges, burning candles, dust, mites, etc., which can greatly impact air quality. Therefore, monitoring indoor air quality is imperative to understand exposure levels to air pollutants and the subsequent potential health effects on the community.
Beginning in 2023, NBN partnered with the NYU Grossman School of Medicine, Division of Environmental Medicine to work with a select group of community members living in North Brooklyn to set up air monitors inside their homes for approximately six months to measure particulate matter (PM2.5) trends in the indoor air.
The Process
A survey was launched in early 2023 to gauge community interests and to recruit participants in the study. Participants would receive a $500 stipend upon completion of the program which included attending an introductory workshop, mid-study check-ins, and hosting an air monitor in their homes. Those who wished to enroll were asked to fill out a quick survey with questions relating to factors that may impact their exposure levels, such as their relative proximity of pollution sources (e.g. truck routes, highways, above-ground subway lines, construction zones), the floor on which they live, and their cooking, cleaning and candle/incense burning habits.
Participants were chosen based on their differing responses to survey questions, offering a variety of potential exposure scenarios as well as endeavoring to enroll both private and public housing study participants. Two cohorts of participants were chosen: the first cohort contained 9 participants and the second cohort had 10 participants. Across both groups, the participants were split between residents of private homes (11 participants) and public housing (8 participants), specifically residents of the Cooper Park Houses. Cooper Park Houses borders the Industrial Business Zone in North Brooklyn, and is situated next to Morgan Avenue, a busy truck route. Thus, its residents are suspected to be exposed to high levels of pollution due to heavy traffic and the idling of trucks during the loading and unloading of goods.
Air sampling took place from May to October 2023 for Cohort 1, and from December 2023 to June 2024 for Cohort 2. PM2.5 monitors were installed for continuous monitoring throughout the entirety of the study, in the common areas (living room or kitchen), where the residents have indicated that they spent the majority of their time at home, while being kept away from direct exposure to potential pollution sources.
In addition to attending an introductory workshop where issues and solutions relevant to indoor air pollution were discussed, all participants were also given a mid-study check-in to discuss the air quality results of their individual homes. Participants were also able to contact researchers throughout the entirety of the study to discuss any concerns and some participants took advantage of this opportunity to discuss spikes in particulate matter in their homes. Researchers also reached out to study participants during the June 2023 wildfire event in which air quality in New York City was greatly impacted. During this time, researchers shared tips on improving indoor air quality and protecting individual health during the unprecedented event. At the end of the study, researchers provided all participants with a final report where individual air quality findings were presented along with suggestions about how to improve indoor air quality.
Summary of Results
The most striking result was higher indoor PM2.5 levels in the homes in Cooper Park Houses, compared to private homes in North Brooklyn. The indoor PM2.5 level at CPH averaged at 22.7 µg/m3, approximately 1.8 times the average level of 12.7 µg/m3 at other residents in North Brooklyn. Furthermore, the average indoor level at Cooper Park Houses was approximately 1.4 higher than the outdoor average of 15.1 µg/m3, with eight out of the nine residents having higher particulate matter levels than measured outdoors, compared to only two residents from elsewhere in North Brooklyn.

During the data collection period for Cohort 1, New York City experienced extreme bad air quality days (from 06/06/23 to 06/12/23) due to the smoke coming from the wildfires in Canada. The average daily outdoor PM2.5 level during this period skyrocketed to 73.4 µg/m3. The resulting impact on indoor air quality was noticeable, as we saw an increase in average indoor PM2.5 levels for both Cooper Park Houses residents and residents of other areas of North Brooklyn to 65.3 µg/m3 and 46.3 µg/m3, respectively.
The majority of our data for Cooper Park Houses was collected from Cohort 1 and so we also thought it important to separate out the extreme values to due to wildfires to examine their effects on overall average levels at Cooper Park Houses. Excluding the data during the wildfire days from our analysis, we did notice a decrease in daily PM2.5 level from 22.7 µg/m3 to 20.9 µg/m3 inside the Cooper Park Houses residences. The average value for residences in other areas of North Brooklyn saw a negligible decrease. However, even after controlling for the wildfire days, the overall average daily PM2.5 level inside CPH residences was still approximately 1.7 times higher than that inside the residences in other areas of North Brooklyn, and approximately 1.4 times higher than the levels measured outdoors.
In trying to understand why such elevated levels were observed, we also looked into the frequency at which the residents performed common household activities that could have affected air quality. Our results showed candle burning could lead to an increase in PM2.5 levels. That is, the more frequent participants burn candles, the higher the increase in PM2.5 level. Those who burned candles 2 to 5 times a week had more than double the increase in PM2.5 levels, compared to those who never burned candles. Proximity to industrial areas and truck routes are also potential causes for the differences in air quality, as the public housing is located adjacent to the Industrial Business Zone.
Lessons learned/Limitations of the study:
To compare PM2.5 levels between indoors and outdoors, we used average NYC outdoor PM2.5 levels. However, the average NYC outdoor level might not accurately represent the variability in outdoor PM2.5 level throughout different areas in the city. Additionally, residents were given only one air monitor to be placed inside their home. To more accurately examine the impact of the immediate outdoor environment on indoor air quality, future studies should aim install a second air monitor directly outside the participants’ home.
Air sampling for the first cohort took place May-October 2023 which included an unprecedented air quality event, the June 2023 wildfire event which greatly affected air quality in New York City for a period of several days. Two separate analyses included and excluded these days.
Because this was an introductory study, survey questions were kept to a minimum. Thus, we did not control for other factors that could have impacted air quality, such as smoking habits, how often the participants opened their windows/used air conditioning, or whether or not they had air purifiers in their home. Nonetheless, the answers to our survey did allow us to observe a potential relationship between candle burning and air quality, which was also seen in other studies. A follow-up study in which participants are asked to reduce their candle burning frequency to observe changes in PM2.5 levels, or an expansion of our survey to encompass other polluting activities might help strengthen hypotheses.
Overall, our results showed that the six-month average PM2.5 levels at Cooper Park Housing residences were at alarmingly high levels. If these levels were to persist, the residents could be exposed to PM2.5 levels above the safety annual guideline level of 9 µg/m3 set by the Environmental Protection Agency. As previously discussed, CPH is located next to an industrialized area, which could have resulted in it being a hotspot for PM2.5 exposure due to its proximity to emissions from factories and diesel vehicles.
Click below for data tables and visualizations:


